The Bridge Gods
The Problem
My parents like to play Bridge. It’s a great card game and totally worth the time it takes to learn all the rules. And there are many. My parents play on opposing teams since my mom has the opinion that one should never partner up with his/her actual partner, for the sake of the marriage. Which is saying something about being Bridge teammates since by being on opposite teams, when you lose, your partner wins.
Anyway, my parents played a few weekends back with some friends and my mom made the following claim to me:
My bridge partner and I NEVER get the points. It’s remarkable! The Bridge Gods always know where we are sitting and give the points to the other team.
This is silly of course. ’Cuz probability. C’mon mom. But then I starting thinking about what might actually be going on. My mom is a super smart lady, but when I push back on her claim, she doesn’t give in.
I decided to look into it.
Declarations and Assumptions
I assume that when my mom is talking about points, she is talking about having enough points in her and her partner’s hand to make Opening Bids. Without the 13 points, you must stay silent. I am not accounting for the fact that the points needed to “respond” to your partner’s Opening Bid is slightly lower than 13. In this simulation, we account for each players ability to make an Opening Bid, without accounting for order.
Trivially, we assume that my mom is seated in the A position (she is person A) and is a member of Team 1 (with partner C). This will be made more clear and relevant in the sections below.
You could try to work out the probabilities by hand (good luck). I thought about this and took a stab at it, until I decided that a simulation would be a better use of my time.
Preliminary Questions to Ask
- What is the probability of obtaining Opening Points?
- What is the probability that both you and your partner have Opening Points?
- What is the probability that the opposing team makes an Opening Bid?
What you need to know about Bridge, BRIEFLY
Disclaimer: This is section will only be telling you about the Bridge rules pretaining to Opening Points. I am definitely not trying to explain how Bridge is played - for this, please take a look at this and this and the rest of the internet.
There are many many rules and everyone plays a slightly different way, so the rules we will adopt in this simulation are as follows:
There are 4 players (A, B, C, and D), with teammates sitting across the table from one another. So, if sitting around a table, Team 1 consists of Players A and C, and Team 2 consists of Players B and D.
Every player is dealt 13 cards from the standard 52 card deck.
Before potentially making an Opening Bid, each player calculates the total number of points in their hand. During the bidding process, they will be cryptically describing their hand to their partner (and to the table), but this is beyond the scope of the post. Total number of points is calulated using this chart.
| Card | Point Value |
|---|---|
| Ace | 4 |
| King | 3 |
| Queen | 2 |
| Jack | 1 |
| 2-10 | 0 |
In a standed deck of cards, there are 40 available points based on the card value. Furthermore, one adds points depending on the number of cards of each suit. These are called “Short Suit Distributional Points”. There is also “Long Suit Distribution Points”, but my parents do not play with this convention.
| Number of Cards in Suit | Point Value |
|---|---|
| 2 | 1 |
| 1 | 2 |
| 0 | 3 |
If, after accounting for card values and number of cards in each suit, your hand has greater than 12 points then you have enough points to make an Opening Bid.
Let’s Simulate
First, I create a dataset with all 52 cards, their point values and assignments to persons A, B, C, and D. I called this dataset bridge.csv and the first couple rows look like this:
data <- read.csv("bridge.csv", header = T)
head(data)
## person team num suit point
## 1 A 1 A spade 4
## 2 A 1 A heart 4
## 3 A 1 A diamond 4
## 4 A 1 A club 4
## 5 A 1 K spade 3
## 6 A 1 K heart 3Don’t worry about the “Person” assignment right now. It is in the dataset so that I may permute these labels and simulate cards being dealt.
Next, I create a function that simulates cards being dealt out and Opening Points being tallied. Furthermore, this function records whether
- Person A has Opening Points
- Team 1 makes an Opening Bid
- either Person A or Person C has Opening Points
- Team 2 makes an Opening Bid
- either Person B or Person D has Opening Points
- Person A and Person C both have Opening Points
bridgebid <- function(rep){

     openingbid <- as.data.frame(matrix(NA,rep,4))
     colnames(openingbid) <- c("ACbid","BDbid","Abid","bothACbid")

     for (i in 1:rep){

          # Deal cards out
          ind <- sample(1:52, size = 52, replace = FALSE, prob = NULL)
          permdata <- cbind(data[,1:2], data[ind,3:5])

          # Calculate points for each hand
          openingbid[i,] <- permdata %>%
               group_by(person) %>%
               mutate(sumpoint = sum(point)) %>%
               count(person,sumpoint,suit) %>%
               add_count(person) %>%
               mutate(additionalpts = ifelse(n <= 2, 1+abs(n-2),0),
                      voidpts = ifelse(nn < 4, 1+(3-nn)*2^(3-nn),0),
                      totpoint = sum(additionalpts) + sum(voidpts) + sumpoint,
                      team1bid = ifelse((person == "A" & totpoint > 12) |
                                             (person == "C" & totpoint > 12),1,0),
                      team2bid = ifelse((person == "B" & totpoint > 12) |
                                             (person == "D" & totpoint > 12),1,0),
                      Abid = ifelse((person == "A" & totpoint > 12), 1,0)) %>%
               ungroup %>%
               mutate(bothACbid = ifelse(sum(team1bid)==8,1,0)) %>%
               summarise(ACbid = max(team1bid),
                         BDbid = max(team2bid),
                         Abid = max(Abid),
                         bothACbid = max(bothACbid)) %>%
               as.data.frame()
     }

     result <- openingbid
}
There are \({52 \choose 13}{39 \choose 13}{26 \choose 13}{13 \choose 13} \approx 5.36 \times 10^{28}\) possible ways to hand out 52 cards to 4 people such that each person gets 13 cards. Which, in case you were wondering, is about 53 octillion. Yikes. There is no way a simulation of mine will be able to run through all possible hands of Bridge, so I would like to check the stability of my estimates as I increase the number of hands dealt to see how few hands we can get away with and still have reliable results.
Below is the code used to compute the necessary estimates:
#runs for plot
runthis <- function(dd){
     run <- bridgebid(dd)
     outrun <- rep(NA,9)
     outrun[1] <- mean(run$ACbid)
     outrun[2] <- mean(run$BDbid)
     outrun[3] <- mean(run$Abid)
     outrun[4] <- mean(run$bothACbid)
     noteambid <- nrow(run[which(run$ACbid==0 & run$BDbid==0),])
     bothteamsbid <- nrow(run[which(run$ACbid==1 & run$BDbid==1),])
     outrun[5] <- noteambid/dd
     outrun[6] <- bothteamsbid/dd
     outrun[7] <- nrow(run[which(run$Abid==0 & run$ACbid==1),])/nrow(run[which(run$Abid==0),])
     outrun[8] <- nrow(run[which(run$Abid==0 & run$BDbid==1),])/nrow(run[which(run$Abid==0),])
     outrun[9] <- nrow(run[which(run$ACbid==0 & run$BDbid==1),])/nrow(run[which(run$ACbid==0),])
     result <- outrun
}

set.seed(4)
outrun1 <- runthis(100)
outrun2 <- runthis(1000)
outrun3 <- runthis(5000)
outrun4 <- runthis(10000)
proportions <- c(outrun1,outrun2,outrun3,outrun4)
Let’s plot to see how stable these estimates are…
names <- c("Team 1 has Opening Points",
           "Team 2 has Opening Points",
           "Person A has Opening Points",
           "Persons A and C have Opening Points",
           "Neither Team Opening Points",
           "Both Teams have Opening Points",
           "C has Opening Points given A does not",
           "Team 2 has Opening Points given A does not",
           "Team 2 has Opening Points given Team 1 does not")
runs <- c(rep(100,9),rep(1000,9),rep(5000,9),rep(10000,9))
runslab <- rep(names,4)
plotdata <- data.frame(runs, runslab, proportions)

# plotting to examine the stability of estimates
g <- ggplot(data = plotdata,
            aes(x = runs,
                y = proportions,
                colour = factor(runslab),
                group = factor(runslab)))

g + geom_line(aes(linetype = factor(runslab)), size = 1.5) +
                   scale_y_continuous(limits = c(0,1)) +
     ggtitle("Stability of Estimates by Total Bridge Games Dealt") +
     xlab("Number of Bridge Games Dealt") +
     ylab("Probability") +
     scale_linetype_discrete(name = "Events") +
     scale_colour_discrete(name = "Events") +
     theme_bw() +
     theme(plot.title = element_text(hjust=0.5))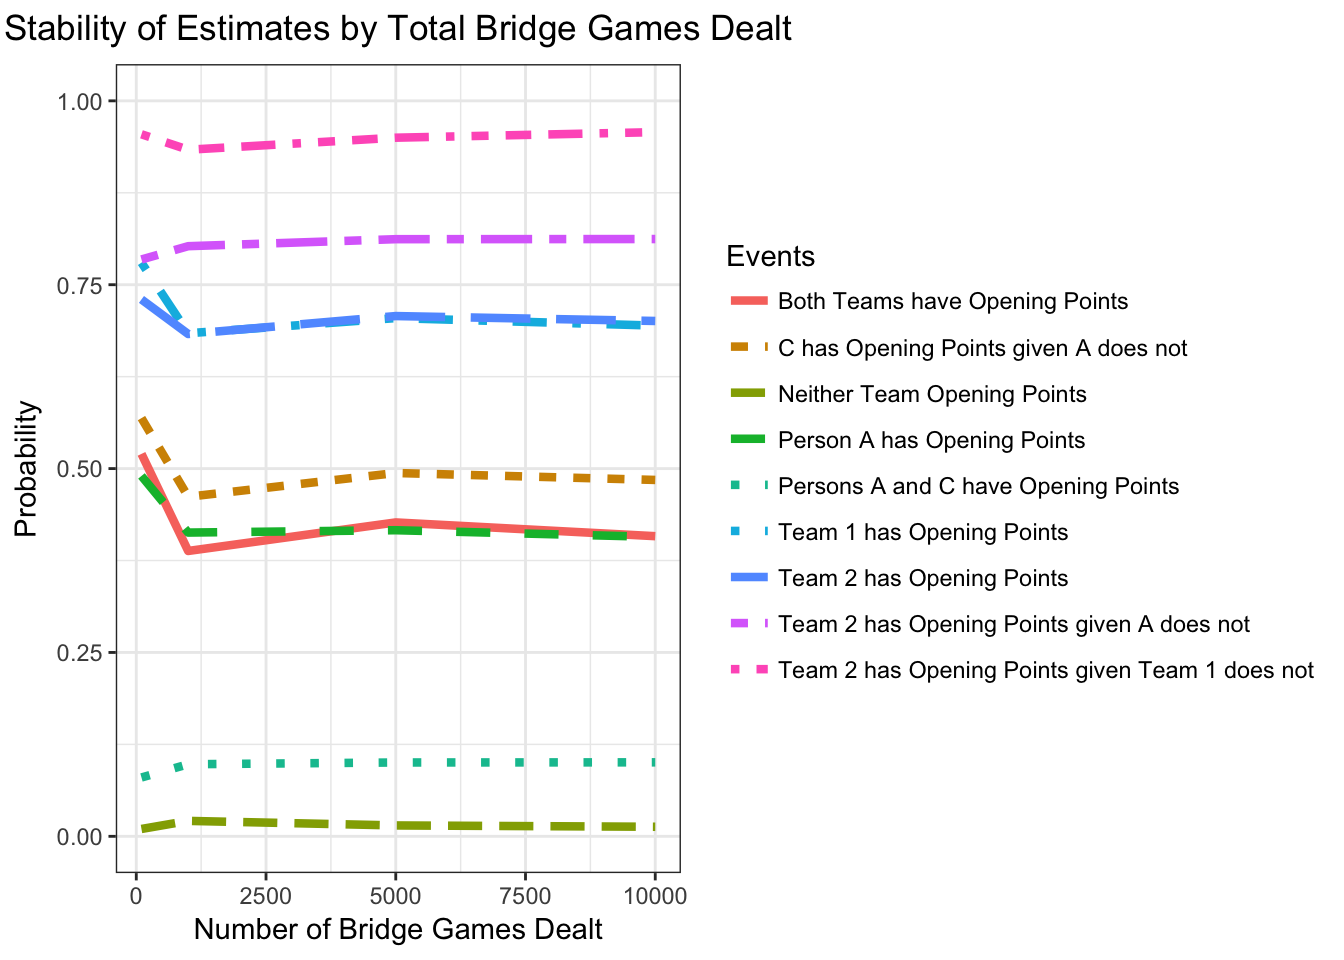
From this plot we see that our estimates are pretty stable at 10,000 games of Bridge dealt. Of course, increasing the number of games would increase the stability of our estimates, but for the purposes of this post, this is good enough.
Let’s Talk Estimates
When we run the simulation for 10,000 dealt hands of Bridge, we get the following proportions:
tab <- plotdata %>%
     filter(runs == 10000)%>%
     mutate(proportions = round(proportions,3))
print(tab)
## runs runslab proportions
## 1 10000 Team 1 has Opening Points 0.694
## 2 10000 Team 2 has Opening Points 0.701
## 3 10000 Person A has Opening Points 0.407
## 4 10000 Persons A and C have Opening Points 0.101
## 5 10000 Neither Team Opening Points 0.013
## 6 10000 Both Teams have Opening Points 0.408
## 7 10000 C has Opening Points given A does not 0.485
## 8 10000 Team 2 has Opening Points given A does not 0.812
## 9 10000 Team 2 has Opening Points given Team 1 does not 0.957So we see that, the probability that your team will have opening points is approximately 70% (Probability that Team X has Opening Points). This means that you can expect that either you or your partner or both will have Opening Points and will be able to make an Opening Bid and start a dialog 70% of games. The probability that you (represented as Person A) will be able to make an Opening Bid is 41%.
So far, these estimates do not sync very nicely with what my mom was experiencing. Since with these numbers, you would think that a 30% (1-0.70 = 0.30) no Opening Bid probability is not exactly comment-worthy.
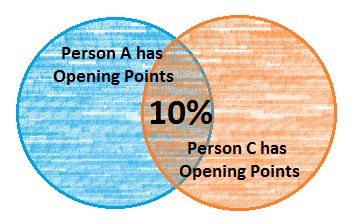
Suppose that, as Person A, you look at your hand and see that you do not have Opening Points (as you would expect 59% of the time based on what we have learned). The probability now, that your partner (Person C) has Opening Points is 49%. Not-too-shabby.
Recall that my mom’s major gripe was that her team does not have the points AND the other team does. Let’s examine this. You might think that of course this must be true, but caution here. 12 points is a decent hand, although not Opening Bid-worthy. If both you and your partner have 12 points each, that leaves only 16 points left to be divided between the members of Team 2 (counting only the value of the cards and not the amount of each suit). So it is not necessarily the case no Opening Bid means that the other team can make an Opening Bid. So, we look to examine the cases where Team 2 can make an Opening Bid given that Team 1 cannot. Now remember that Team 2 has a 70% chance of having Opening Points, same as Team 1. Upon seeing that you do not have Opening Points (Person A < 13 points), the probabilty that Team 2 will have Opening Points INCREASES to 81%. Furthermore, if you AND your partner do not have opening points, then the probability that Team 2 will have Opening Points increases to 96% !!! This shouldn’t be too surprising, as the points are not in your hand and not in your partners hand and the must be somewhere…
Moreover, the feeling that you and your partner never have all/most of the points is justified, since only 10% of the time can both you and your partner both make an Opening Bid.
It must be noted here that this also means that Team 2 has all the points only 10% of the time…
Conclusions Part 1
Remember, the problem here is that the “Bridge Gods” are favoring the opposing team with all the points.
But we discovered that after the cards are dealt and before they are looked at, each Team has 70% chance of making an Opening Bid.
I believe that the “Bridge God” phenomenon can be explained by my mom looking at her hand and then drawing conclusions. As soon as she looks at her hand and determines that she does not have points (which will happen 65% of the time), she immediately effects the probabilities of the other events since her conclusions are now drawn from the conditional of “given I don’t have points.” By noticing her lack of points, the probability of Team 2 having points increases greatly.
From this vantage point, it could seem like Team 2 always has all the points. After seeing that she doesn’t have the points (59% chance of this), there is a 81% chance that Team 2 will have Opening Points. After seeing that even her partner doesn’t have Opening Points (51% chance of this), there is a 96% chance that Team 2 will have Opening points!
This is also compounded by the fact that only 10% of the time both her and her partner have Opening Points. So, it might felt like the deck is, quite literally, stacked against you.
It should be noted that these are the estimates for 10,000 hands of Bridge (which we showed to be fairly stable). Not a lot of hands in the grand scheme of things, but certainly more hands than my mom is playing in one night. In fact, she is probably playing less than 20 hands in one night. Having said this - it is very likely that she and her partner did receive low scoring hands every time and simply had a string of bad luck.
My mom didn’t like my conclusions…
I gave my mom the first draft of this post to look at. She was unhappy with my conclusions. She maintains that she has not been biased and so I followed up with a few questions (I asked her to estimate the answers):
- How often do you and/or your partner have Opening Points?
- She said that out of 15 games, this happens 4 times.
- How often does the other team have Opening Points?
- She said that out of 15 games, Team 2 has Opening Points 12 times.
Now, for full disclosure, I asked my dad the same question.
- How often do you and/or your partner have Opening Points?
- He said that out of 15 games, this happens 12 times.
- How often does the other team have Opening Points?
- He said that out of 15 games, Team 2 has Opening Points 9 times.
So my parents agree that my dad’s team, Team 2 has Opening Points approximately 80% of the time, but they differ greatly on how often Team 1, my mom’s team, has Opening Points (dad said 60%, mom said 27%).
We know that there is 70% chance that a Team will have Opening Points. Using my mom’s numbers, the probability that she would see Team 2 having Opening Points 12 or more games out of 15 is 17%. The probability that she would see Team 1 (her team) having Opening Points in 4 games or fewer out of 15 games is 0.06%. Using my dad’s numbers, the probability that she would see Team 1 having Opening Points in 9 games or fewer out of 15 is 14%.
dbinom(12,15,0.7) #p value that Team 2 has Opening Points, according to my mom and dad## [1] 0.1700402dbinom(4,15,0.7) #p value that Team 1 has Opening Points 4/15 times, according to my mom## [1] 0.0005805754dbinom(9,15,0.7) #p value that Team 1 has Opening Points 9/15 times, according to my dad## [1] 0.147236qbinom(0.05,15,0.7) #how many hands it would take to declare statistical significance## [1] 7So, my mom is right if she is estimating correctly. If she and her partner are getting Opening Points only 27% of the time, then this a statistically significant departure from what should be happening and one might conclude that the “Bridge Gods” are out to get her team. In fact, if she and her partner have Opening Points 7 or fewer games out 15, this would be statistical significant.
However, what my dad estimated (Opening Bid for my mom’s team 9 out of 15 games, 60%) does not show a statistically significant result. Opening points 9 games out of 15, while low, is totally within the plausible realm of possibilities given that the true probability of Opening Points for a team is 70%.
Overall Conclusions
My mom is mis-estimating/under-estimating her Opening points because of natural biases discussed in this post
OR
my dad is cheating. My mom is not usually wrong…