Plotting a Sequential Binary Partition on a Tree in R
For users of PhILR (Paper, R Package), and also for users of the ILR transform that wan to make use of the awesome plotting functions in R. I wanted to share a function for plotting a sequential binary partition on a tree using the ggtree package. I recently wrote this for a manuscript but figured it might be of more general use to others as well.
In its simplest form a sequential binary partition can be represented as a binary tree.
ggtree(tr)+
  geom_label2(aes(label = label))
However, as in the case of the ILR (or PhILR) transforms, we may have specific orientation information distinguishing between the top/bottom or left/right descendant of an internal node. In this case a sequential binary partition can be represented in sign matrix form in which 1 represents an “up” (or, for PhILR, a tip in the numerator of a balance), a -1 represents a “down” (or a tip something in the denominator), and a 0 represents a tip not downstream of that partition (or a tip not part of that balance). I will generate a sequential binary partition by using the function phylo2sbp in the philr R package.
(V <- phylo2sbp(tr))## n1 n2 n3 n4 n5 n6 n7
## t1 1 1 0 0 0 0 0
## t4 1 -1 0 0 0 0 0
## t6 -1 0 1 1 1 0 0
## t7 -1 0 1 1 -1 0 0
## t8 -1 0 1 -1 0 0 0
## t3 -1 0 -1 0 0 1 1
## t2 -1 0 -1 0 0 1 -1
## t5 -1 0 -1 0 0 -1 0Here is a simple function that will augment the labels from a ggtree object with the information in the sign-matrix. The only reason this is semi-non-trivial is that ggtree has its own internal mechanisms for orienting branches by default. This function takes a ggtree object (which if not specified it will also create) and correctly labels the internal nodes in accordance with the ggtree object.
# - Assumes tree's internal nodes and tips are named
# - can pass smaller contrast matrix to subset which are annotated
# - A prebuilt ggtree object with corresponding tip/node names can be passed as
#     argument p
# - Currently designs for trees in vertical layout (see example below)
annotate_sbp <- function(tr, V, p=NULL){
  sep <- "\n"
  if (!setequal(tr$tip.label, rownames(V))) stop("mismatch between tip.label of tree and rownames of V")
  if (!setequal(tr$node.label, colnames(V))) stop("mismatch between node.label of tree and colnames of V")
  if (is.null(p)) {
    p <- ggtree(tr)
    need.annotation <- TRUE
  }
  d <- p$data
  n.tip <- ape::Ntip(tr)
  n.node <- ape::Nnode(tr)
  n.numbers <- (n.tip+1):(n.node+n.tip)
  children <- phangorn::Children(tr, n.numbers)
  children <- lapply(children, function(x) x[order(c(d[x,"y"]$y),decreasing=TRUE)])
  names(children) <- tr$node.label
  V.sign <- sign(V)
  tips <- phangorn::Descendants(tr, 1:nrow(d), type="tips")
  tips <- lapply(tips, function(x) tr$tip.label[x])

  l <- list()
  for (n in names(children)){
    signs <- sapply(children[[n]], function(x) unique(sign(V[tips[[x]], n])))
    signs <- ifelse(signs==1, "+", "-")
    l[[n]] <- paste(signs[1], n, signs[2], sep=sep)
  }
  l <- unlist(l)
  d.order <- d$label[d$label %in% names(l)]
  d$label[d$label %in% names(l)] <- l[d.order]
  p$data <- d
  if (need.annotation) return(p + geom_label2(aes(label=label)))
  p
}
Here is an example of the output
annotate_sbp(tr, V)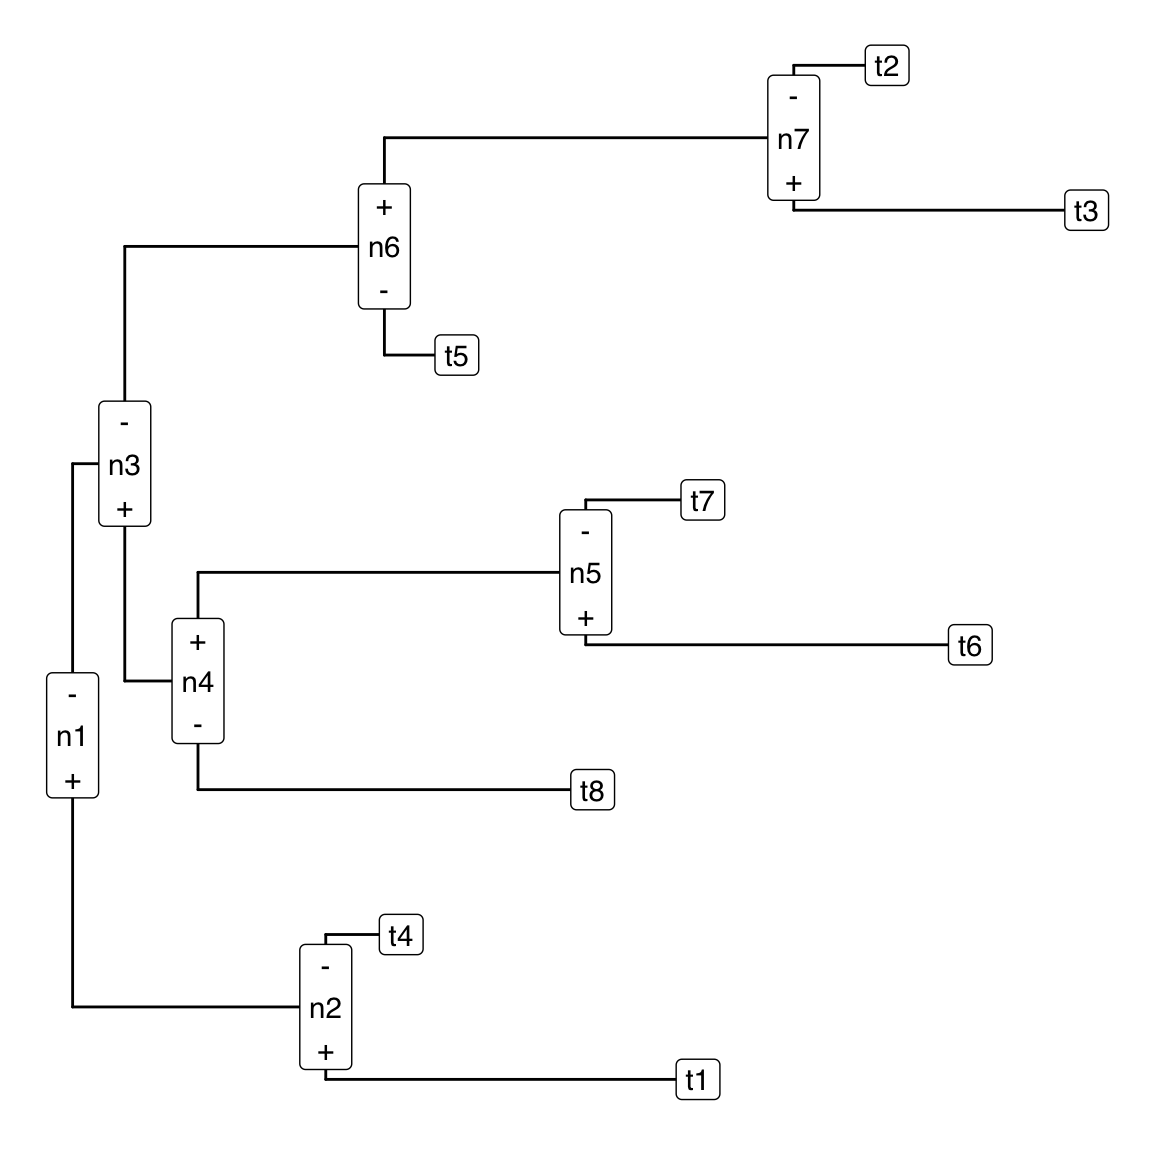
Hopefully this is a pretty self-explanatory graphic. The (+) and (-) denote which of the two sub-trees contains the +1’s and -1’s in the sign-matrix form. In the language of PhILR/ILR the (+) points to the tips in the numerator of the balance and the (-) points to the denominator of the balance. If people like this function and if I have time to make it integrate more seamlessly with different tree geometries (e.g., radial fan layouts) I will add it to the philr R package.